.png)


TL;DR:
- Website conversion optimization focuses on improving key elements like headlines, CTAs, and social proof that directly influence visitor actions. Proper A/B testing, fixing technical and mobile UX issues, and tracking relevant metrics are essential for sustained growth. Prioritizing high-impact structural changes over cosmetic micro-changes can significantly boost conversion rates and overall site performance.
Website conversion optimisation (CRO) is the systematic process of increasing the percentage of website visitors who complete a desired action, whether that is making a purchase, submitting a form, or booking a call. Conversion rates dropped 6.1% year-over-year in 2025 despite a 13.2% increase in digital ad spend, which means businesses are paying more to attract visitors who are less likely to convert. That gap is precisely what this website conversion guide addresses. Using frameworks like ICE prioritisation, tools like Contentsquare and Shopify A/B testing, and 2026 benchmarking data, you can turn your existing traffic into measurable revenue growth.
What are the highest-impact website elements to optimise?
The most effective place to start any CRO programme is with the elements that directly influence a visitor’s decision to act, not the ones that simply look appealing. Many businesses waste months testing button colours when the real conversion killers are weak headlines, vague calls to action, and absent social proof.
Here are the website elements that consistently deliver the highest conversion lifts:
- Headlines and value propositions. Your headline is the first thing a visitor reads and the primary reason they stay or leave. A headline that clearly states what you offer, who it is for, and why it matters can lift conversions significantly without changing anything else on the page.
- CTA copy and placement. Effective CTA copy passes the “what happens next” test. It is benefit-oriented, specific, and reduces friction. “Get my free audit” outperforms “Submit” every time. Placement matters too. CTAs above the fold perform better for cold traffic, while CTAs after testimonials work well for warmer audiences.
- Social proof and testimonials. Specificity is what makes testimonials convert. “This tool saved us 4 hours a week” beats “Great product!” because it is credible and quantifiable. Video testimonials, case study links, and recognisable client logos all add trust signals that reduce purchase anxiety.
- Form length. Fewer form fields increase completion rates by 15 to 25% without significantly reducing lead quality. If you are asking for a phone number, job title, and company size on a first-touch form, you are losing leads before they even start.
- Hero images and video. Visuals that show the product in use or demonstrate the outcome of your service outperform abstract lifestyle imagery. A short explainer video in the hero section can increase time on page and reduce bounce rates.
- Pricing presentation. Anchoring a higher price next to your recommended option makes the latter feel like a bargain. Showing a monthly equivalent for annual plans reduces sticker shock. These are not tricks; they are clarity improvements.
Pro Tip: Avoid testing cosmetic micro-changes like font sizes or background shades until you have exhausted high-impact structural tests. High-impact A/B tests focus on headlines, CTA copy, hero layout, and social proof. Start there.
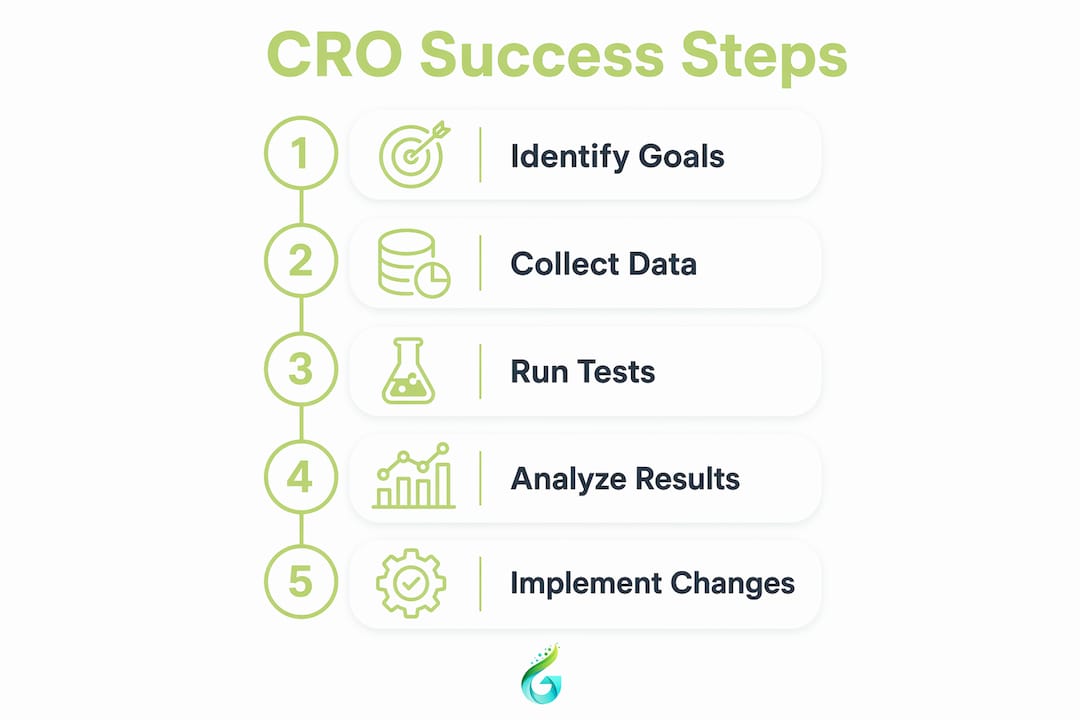
How to plan and execute A/B tests that actually improve conversions
A/B testing is the backbone of any serious CRO effort, but most businesses run tests incorrectly and draw conclusions from data that cannot support them. Done properly, A/B testing removes guesswork and replaces it with evidence.
Follow this process to run tests that produce reliable results:
- Define a clear goal and primary metric. Every test needs one primary metric, such as click-through rate, form completions, or purchase rate. Secondary metrics provide context but should not determine the winner.
- Calculate your required sample size before you start. Use a sample size calculator to determine how many visitors you need in each variant to detect a meaningful difference. Running a test on 200 visitors and calling a winner is not testing; it is guessing.
- Test one variable per variant. Testing one change per variant is the only way to know what caused the result. If you change the headline and the CTA simultaneously, you cannot attribute the outcome to either.
- Run tests to statistical significance. Aim for at least 95% statistical significance before declaring a winner. Stopping a test early because one variant looks promising is called “peeking” and it produces false positives at an alarming rate.
- Avoid overlapping tests on the same page. Running two tests simultaneously on the same URL contaminates both data sets. Run tests sequentially, not in parallel, unless you are using a multivariate testing tool designed for it.
- Document every test outcome, including failures. A test that shows no improvement is not a failure. It tells you what your audience does not respond to, which is equally valuable. Build a test log that records hypothesis, result, and interpretation.
Pro Tip: Never run A/B tests during abnormal traffic periods such as bank holidays, product launches, or major sales events. Skewed traffic behaviour will invalidate your results and send you in the wrong direction.
| Test element | Impact level | Why it matters |
|---|---|---|
| Headline copy | High | Directly affects whether visitors stay or leave |
| CTA text and placement | High | Determines whether visitors take the next step |
| Social proof format | Medium to high | Builds trust and reduces purchase hesitation |
| Form field count | Medium | Affects lead capture volume and quality |
| Button colour | Low | Rarely moves conversion rates meaningfully |
Which UX and technical improvements increase conversions?
Conversion rate best practices extend well beyond what you test. The technical and experiential quality of your website sets the ceiling for what any test can achieve. If your site is slow, broken on mobile, or confusing to navigate, no amount of CTA testing will save it.

Website speed is the most underestimated conversion factor. A site loading in one second converts up to three times better than one loading in five seconds. That is not a marginal difference; it is the difference between a profitable site and one that bleeds ad spend. Compress images, use a content delivery network, and audit your third-party scripts regularly.
Mobile UX deserves its own dedicated focus. Desktop conversion rates are 74% higher than mobile, yet mobile drives the majority of traffic. That gap represents an enormous opportunity. Improving mobile UX, including tap target sizes, scroll depth, and checkout flow, can lift your overall conversion rate without acquiring a single new visitor. Many businesses still design for desktop first and treat mobile as an afterthought. That approach is increasingly costly.
Tools like heatmaps, session replays, and frustration scores from platforms like Contentsquare identify UX pain points that analytics alone cannot surface. Watching a session replay of a user repeatedly tapping a non-clickable element or rage-clicking a broken button tells you more in two minutes than a month of bounce rate data. Fix errors, remove friction, and then test improvements.
Content quality and authority also contribute to conversion. Visitors who trust your expertise are more likely to act. Clear, well-structured copy, relevant case studies, and accurate product information all reduce the cognitive load that causes visitors to hesitate. For a deeper look at how website design drives lead generation, the structural and visual decisions you make have a direct impact on whether visitors convert.
What tools and metrics should you track for ongoing CRO success?
Sustaining conversion improvements requires consistent measurement. Without the right tools and metrics in place, you are optimising blind.
Contentsquare is one of the most capable platforms for journey and funnel analysis at scale. It combines heatmaps, session replay, zone-based analytics, and frustration scoring into a single view of how visitors interact with your site. For businesses running high volumes of traffic, it provides the depth of insight needed to make confident decisions.
Beyond platform choice, the metrics you track determine the quality of your decisions. Conversion rate is the obvious headline figure, but it tells you little on its own. Pair it with bounce rate, session depth, and device-specific benchmarks to understand where and why visitors drop off. Return visitors convert at 2.9% compared to 1.7% for new visitors, which means retention strategies, such as email sequences, retargeting, and personalised content, are a direct lever for improving overall conversion performance.
Paid traffic analysis is equally important. Paid social traffic increased by 12% in 2025 but produced higher bounce rates and lower conversions than organic traffic. If you are investing in Meta or Google Ads without analysing post-click behaviour, you are likely funding a leaky funnel. Integrating your ad platform data with on-site analytics gives you a complete picture of where spend is working and where it is not.
| Tool | Primary use | Key metric |
|---|---|---|
| Contentsquare | Journey and funnel analysis | Frustration score, session depth |
| Google Analytics 4 | Traffic and conversion tracking | Conversion rate, bounce rate |
| Hotjar | Heatmaps and session replay | Click maps, scroll depth |
| Optimizely | A/B and multivariate testing | Statistical significance, uplift |
| Google Search Console | Organic performance | Click-through rate, impressions |
For a broader view of how these tools fit into a full digital strategy, the digital marketing optimisation guide from Geo Growth Media covers how paid, organic, and on-site efforts connect.
Key takeaways
Effective website conversion optimisation requires prioritising high-impact structural changes, running statistically valid A/B tests, and fixing technical and mobile UX issues before investing further in traffic acquisition.
| Point | Details |
|---|---|
| Prioritise high-impact elements | Test headlines, CTA copy, and social proof before cosmetic changes. |
| Run tests correctly | Use one variable per variant and wait for 95% statistical significance. |
| Fix mobile UX first | Desktop converts 74% better than mobile, so closing that gap is a major opportunity. |
| Track the right metrics | Pair conversion rate with bounce rate, session depth, and device benchmarks. |
| Retain visitors actively | Return visitors convert at 2.9% vs 1.7% for new visitors, making retention a direct revenue lever. |
Our honest view on CRO priorities
At Geo Growth Media, we see the same pattern repeatedly. Businesses come to us having spent months testing button colours and font weights while their checkout flow has a broken field on iOS and their mobile page speed score is in the red. It is like rearranging furniture in a house with a leaking roof.
The ICE framework (Impact, Confidence, Effort) exists precisely to prevent this. Score every potential test against those three criteria before you run it. A headline change on your highest-traffic landing page scores high on impact and confidence. A colour tweak on a secondary CTA scores low on both. The prioritisation is not complicated, but it requires discipline to follow when the temptation to “just try something quick” kicks in.
Failed tests are not wasted time. Every test that shows no improvement is a data point that sharpens your understanding of your audience. We have seen clients learn more from three failed tests than from a year of inconclusive tweaks. The goal is not to win every test; it is to build a body of evidence that compounds over time.
Mobile is the area we push hardest on with clients who are reluctant to invest in UX improvements. The traffic is there. The conversion rate is not. That gap is not a mystery; it is an opportunity with a clear solution. Prioritise it.
— Geo Growth Media
How Geo Growth Media can help you convert more visitors
If you have read this far, you already know that improving conversions is not about one quick fix. It is about a structured, ongoing process of testing, measuring, and improving.
Geo Growth Media works as an extension of your marketing team to do exactly that. Our paid social media campaigns drive qualified traffic from Meta, TikTok, and LinkedIn to pages built to convert. Our SEO services attract high-intent organic visitors who are already looking for what you offer. And our landing page design service applies tested layouts and messaging to maximise the value of every visit. Get in touch with Geo Growth Media to discuss a tailored CRO strategy for your business.
FAQ
What is a good website conversion rate?
Average conversion rates vary by industry, but most websites convert between 2% and 5% of visitors. Contentsquare’s 2026 benchmarks show return visitors convert at 2.9% compared to 1.7% for new visitors, so your baseline depends heavily on your traffic mix.
How long should an A/B test run?
An A/B test should run until it reaches at least 95% statistical significance, which typically requires a minimum of one to two weeks of data. Stopping early based on early results is one of the most common and costly mistakes in CRO.
Which pages should I optimise first?
Start with your highest-traffic pages that have clear conversion goals, such as your homepage, primary landing pages, and checkout flow. These pages offer the largest potential return because even a small percentage improvement affects a large volume of visitors.
Does page speed really affect conversions?
Yes, directly. A site that loads in one second converts up to three times better than one loading in five seconds. Speed improvements are often the highest-return technical change a business can make before running any other tests.
How do I improve mobile conversion rates?
Focus on tap target sizes, simplified navigation, faster load times, and a frictionless checkout or form experience. Optimising mobile UX is one of the highest-leverage moves available, given that mobile drives the majority of traffic but converts at significantly lower rates than desktop.
.png)