.png)


TL;DR:
- Standard ecommerce dashboards reveal what happened but often lack insights into why and what actions to take. Cohort analysis and key KPIs like retention rate and customer lifetime value help uncover underlying customer quality and growth opportunities. Effective use of analytics requires continuous iteration, combining quantitative data with qualitative insight to drive strategic decision-making and sustainable growth.
Standard ecommerce dashboards tell you what happened. They rarely tell you why, or what to do next. Many marketing managers at small to medium-sized retailers pour time into tracking sessions, bounce rates, and revenue totals, then make strategic decisions based on what are essentially summary statistics. The problem is that aggregate numbers mask the underlying signals that separate a store with sustainable growth from one that is quietly stagnating. Cohort analysis groups customers by shared characteristics to track retention and revenue over time, revealing whether your acquisition efforts are actually building durable value. This article gives you the practical frameworks to move beyond surface-level reporting and find the opportunities your competitors are missing.
Table of Contents
- Understanding the building blocks: Key ecommerce analytics metrics
- Diagnosing performance: Cohort analysis and customer quality
- Personalisation and audience activation: Turning analytics into action
- Benchmarking, bias, and analytics at scale: Navigating real-world challenges
- Why most ecommerce analytics advice falls short for agile retailers
- Take your ecommerce analytics to the next level
- Frequently asked questions
Key Takeaways
| Point | Details |
|---|---|
| Track actionable KPIs | Focus on metrics like retention, AOV, and cart abandonment that drive growth decisions. |
| Use cohort analysis | Cohorts expose customer trends and issues that standard reports often miss. |
| Activate personalisation | Leverage analytics for tailored recommendations and campaign impact measurement. |
| Beware scaling pitfalls | As retailers grow, analytics models must adapt to accurately reflect costs and performance. |
| Benchmark wisely | Compare against industry standards but prioritise your own business history for real insights. |
Understanding the building blocks: Key ecommerce analytics metrics
Before you can extract real insight from your data, you need clarity on which metrics actually drive decisions and which ones simply fill space on a report. Ecommerce KPIs typically span financial unit economics and funnel performance, and they should be reviewed on a cadence that matches the nature of the metric itself.
Here is a practical breakdown of the core KPIs every ecommerce marketing manager should have visible at all times:
- Average order value (AOV): The mean revenue generated per transaction. Rising AOV without a corresponding drop in conversion rate signals effective upselling or bundling.
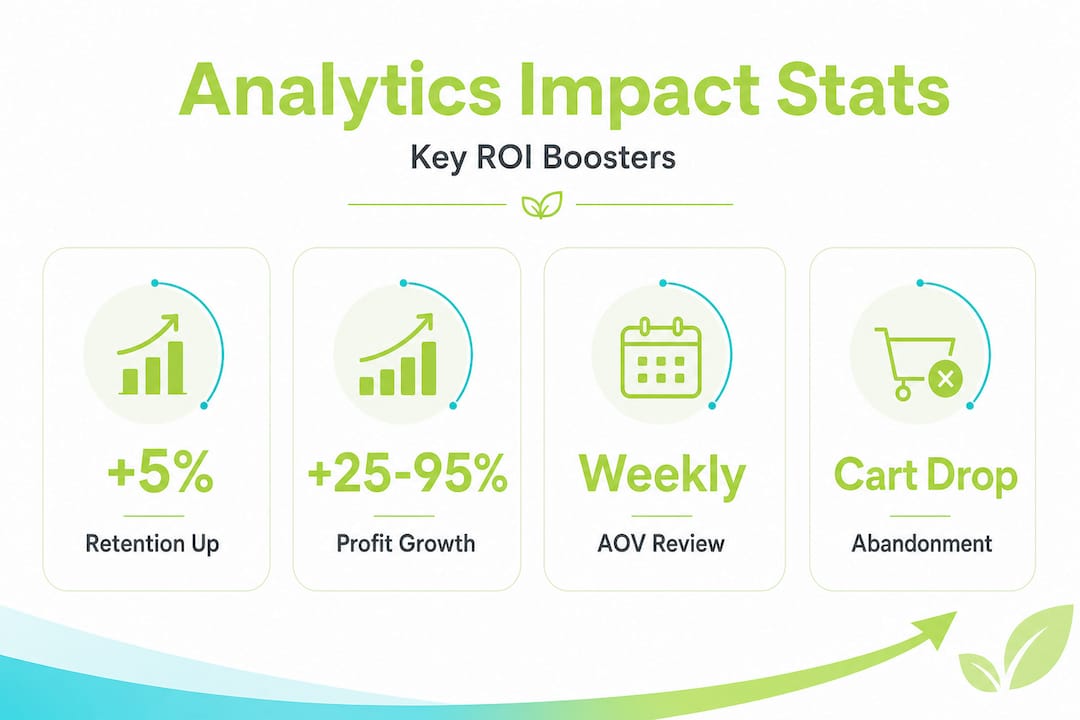
- Customer retention rate: The percentage of customers who make a repeat purchase within a defined period. This is arguably the most important long-term growth indicator for any SME.
- Shopping cart abandonment rate: The proportion of shoppers who add items but do not complete checkout. Industry averages hover around 70%, making even a modest reduction extremely valuable.
- Revenue per visit: Total revenue divided by total site visits. This metric bridges traffic quality with commercial output in a single figure.
- Customer lifetime value (CLV): The total projected revenue a customer generates across their relationship with your brand. Pairing CLV with customer acquisition cost (CAC) tells you whether your paid channels are actually profitable over time.
Review cadence matters as much as the metrics themselves. AOV and cart abandonment warrant weekly scrutiny because small changes respond quickly to tactical adjustments such as a revised checkout flow or a new bundle offer. Customer retention rate and CLV are better reviewed monthly or quarterly because they reflect patterns that develop across multiple purchase cycles.
| Metric | Review frequency | Primary decision it informs |
|---|---|---|
| Average order value | Weekly | Bundling and upsell strategy |
| Cart abandonment rate | Weekly | Checkout optimisation |
| Customer retention rate | Monthly | Loyalty programme investment |
| CLV vs. CAC | Monthly/quarterly | Paid channel budget allocation |
| Revenue per visit | Weekly | Traffic quality and landing page performance |
Understanding how analytics supports ROI decisions starts with this metric layer. If you are not confident in these figures today, fixing the data foundation is the single highest-leverage activity you can undertake.
Pro Tip: Separate your metrics into lead indicators (ones that predict future performance, such as repeat purchase rate) and lag indicators (ones that confirm past performance, such as monthly revenue). Making decisions purely from lag indicators means you are always reacting rather than steering.
A telling statistic: increasing customer retention by just 5% can increase profits by between 25% and 95%, according to widely cited research in customer economics. That alone makes retention rate the metric most worth obsessing over for any SME with limited acquisition budgets.
Diagnosing performance: Cohort analysis and customer quality
With your core KPIs mapped out, the next step is to understand which customers are driving those numbers. This is where most standard dashboards completely fall short, and where cohort analysis becomes genuinely powerful. Grouping customers by a shared characteristic, such as acquisition date or source channel, and tracking their retention, repeat purchase rate, and revenue over time tells you whether your acquisition is producing durable value or expensive one-time buyers.
Consider this scenario. Your monthly revenue is stable. New customer acquisition looks healthy. Conversion rate is holding. Most marketing managers would call that a green light. But cohort analysis might reveal that customers acquired through a particular paid campaign six months ago have a 90-day retention rate of 8%, while customers acquired through organic search retain at 34%. Topline stability was masking a serious quality problem in your paid acquisition mix.
Here is how to build cohort tracking into your regular workflow:
- Define your cohort dimension. Start with acquisition month or quarter. Once you have that working, layer in acquisition channel (organic, paid social, email) as a secondary dimension.
- Choose a retention event. For most retailers, this is a second purchase within 90 days. Define it clearly and apply it consistently across all cohorts.
- Build a rolling 12-month view. This lets you compare cohorts at the same point in their lifecycle, so a three-month-old cohort is always compared at the same stage as cohorts from prior periods.
- Flag outliers immediately. Any cohort showing significantly lower retention than the baseline for its acquisition period needs investigation before you scale that channel further.
- Connect cohort data to CLV. A cohort that retains well but has low AOV may still be less valuable than a lower-retention cohort with high initial spend. You need both dimensions to make a sound judgement.
“Cohort analysis is one of the most reliable ways to diagnose whether a seemingly healthy store is actually cannibalising its own growth through low-quality acquisition.” This insight, backed by research into ecommerce analytics for growth, is why cohort thinking should sit at the centre of any serious retention strategy.
Monthly KPIs versus cohort analysis: what each reveals
| What monthly KPIs show | What cohort analysis reveals |
|---|---|
| Total revenue trend | Whether revenue comes from loyal or one-time buyers |
| New vs. returning customer split | Retention trajectory for each acquisition wave |
| Blended conversion rate | Conversion quality by channel and campaign |
| Overall cart abandonment | Whether certain segments abandon more than others |
| Aggregate AOV | Whether repeat buyers spend more over time |
The contrast is stark. Monthly aggregates give you a snapshot. Cohort analysis gives you a film reel showing how customer relationships actually develop.

Personalisation and audience activation: Turning analytics into action
Once you have diagnosed where value and drop-offs occur in your customer base, the next step is using that intelligence to drive genuinely personalised experiences. Analytics supports personalisation by combining behavioural signals and journey context to activate audiences and measure the actual lift from campaigns, rather than relying on assumed attribution.
Practical use cases that SMEs can implement without an enterprise-level tech stack include:
- Cross-sell triggers: Customers who purchased product A and browsed product B but did not buy it are prime candidates for a targeted email sequence or paid retargeting ad featuring product B.
- Drop-off recovery: Identify the specific page or step in the funnel where high-value customer segments are exiting, then test targeted interventions such as a limited-time offer or a social proof element at that exact point.
- Campaign lift measurement: Rather than attributing all revenue to the last click, use holdout groups to measure the incremental lift from a specific campaign. This gives you a far more honest picture of what each channel is actually contributing.
- RFM segmentation: Recency, frequency, and monetary value segmentation lets you tailor communications based on actual purchase behaviour rather than generic demographic assumptions.
- Seasonal reactivation: Analytics can identify customers whose purchase cycle aligns with seasonal events. Reaching them ahead of their natural buying moment, rather than blasting the entire list, improves both conversion rate and unsubscribe metrics.
Research consistently shows that advertising tips for ecommerce ROI revolve around precision rather than volume. Personalised product recommendations alone can drive conversion rate uplifts of 10% to 30% in well-optimised stores.
Pro Tip: Do not activate personalisation on real-time journey data without also running post-campaign analysis. Real-time triggers are powerful, but without retrospective analysis you will keep optimising against local maxima and miss structural issues in the journey.
One pitfall worth flagging is what practitioners call “overfitting” your personalisation. If you build hyper-specific audience segments based on very small data sets, your targeting becomes unreliable and you lose the broader signals that indicate wider audience shifts. Maintaining a healthy balance between granular segmentation and statistically meaningful sample sizes is essential. Pair this with SEO best practices for ecommerce to ensure you are reaching new audiences at the top of the funnel while retaining existing ones with precision targeting further down.
Benchmarking, bias, and analytics at scale: Navigating real-world challenges
Analytics drive personalisation and campaign measurement, but as your store scales, it is critical to recognise where your tools might actually mislead you. Analytics stacks can fail at scale due to cost and revenue mapping complexities including returns, delayed costs, bundles and kits, and cross-channel reconciliation. Many out-of-the-box platforms produce metrics that look clean but are structurally inaccurate for SKU-level unit economics.
Here are the most common hidden biases in ecommerce reporting that SMEs rarely address until they are already causing expensive decisions:
- Attribution window mismatches: A 7-day click attribution window on Meta ads and a 30-day window on Google Ads means you are comparing fundamentally different measurement standards when evaluating channel efficiency.
- Returns not reconciled: If returns are processed days or weeks after the sale, your revenue and margin figures will be overstated during peak periods.
- Bundle and kit complexity: Selling product bundles means your per-SKU revenue and margin data becomes unreliable if your analytics platform cannot disaggregate bundle components correctly.
- Cross-channel double counting: A customer who sees a Meta ad, clicks a Google Shopping result, and then converts via an email link may be counted as a conversion by all three channels simultaneously.
Benchmarks exist but vary widely by data source, definition, and segment. The most useful benchmarking approach is to compare against industry baselines whilst simultaneously building your own store’s historical baseline. External benchmarks tell you roughly where you stand. Your own history tells you whether you are improving.
| Analytics failure mode | Recommended SME action |
|---|---|
| Returns not reconciled in revenue | Implement a returns-adjusted revenue report, reviewed monthly |
| Attribution window inconsistency | Standardise windows across all platforms before comparing |
| Bundle revenue misattribution | Use a data layer or custom event tracking to disaggregate |
| Missing delayed costs (e.g. fulfilment) | Build contribution margin reports separate from platform dashboards |
| Cohort data unavailable natively | Export raw transaction data and build cohort models in a spreadsheet |
Understanding performance marketing benchmarks is a useful starting point, but the retailers who win are those who develop a deep, critical relationship with their own data models rather than accepting platform dashboards at face value.
Pro Tip: Schedule a quarterly review of your metric definitions. As your product catalogue, fulfilment model, or channel mix evolves, existing KPI definitions may no longer reflect business reality. Updating them proactively prevents decisions being made on stale frameworks.
Why most ecommerce analytics advice falls short for agile retailers
Having worked through the mechanics and the pitfalls, it is worth being direct about something. Most analytics guides and platform vendors oversell the idea that better dashboards produce better decisions automatically. They do not. A beautifully designed dashboard populated with the wrong questions produces confident, expensive mistakes faster than no dashboard at all.
The retailers who extract genuine competitive advantage from analytics share one characteristic. They treat metric frameworks as living documents, not permanent fixtures. They revisit their cohort definitions when they launch a new product category. They adjust their attribution windows when they add a new channel. They stop tracking a metric when it stops informing a real decision, rather than keeping it because it was always there.
There is also an underappreciated role for qualitative insight. Analytics tells you where customers are dropping off. It rarely tells you why without additional input such as on-site surveys, customer interviews, or session recordings. The most effective ecommerce marketing teams combine quantitative signals with qualitative context, and they do it continuously rather than in quarterly research sprints.
Rapid iteration is the other element that separates agile retailers from those who stall. Running a cohort analysis and then waiting three months to act on the findings is not agile. Building a culture where insights generate testable hypotheses within days, and where results feed back into the next cohort review, is. This approach to ecommerce growth through analytics is what turns a capable team into a genuinely data-driven one.
Beware rigid thinking. The KPIs that matter most in your store’s first year of scaling are often not the same ones that matter most once you have achieved meaningful retention. Adapting your measurement framework as the business evolves is not a sign of inconsistency. It is a sign of strategic maturity.
Take your ecommerce analytics to the next level
Understanding analytics frameworks is one thing. Implementing them effectively alongside your paid media, SEO, and broader growth strategy is another challenge entirely.

At Geo Growth Media, we work as an extension of your in-house team to build measurement frameworks that actually reflect how your business operates, not how a platform vendor assumes it does. Whether you need a structured analytics audit, support with campaign attribution, or a joined-up strategy across paid social, search, and SEO, our digital marketing services are built around measurable outcomes and genuine transparency. If you are running an online retail operation and want your analytics to drive real decisions rather than fill slide decks, explore our ecommerce marketing solutions to see how we can help you scale with confidence.
Frequently asked questions
What are the most important ecommerce analytics KPIs for SMEs?
Core KPIs include average order value, customer retention rate, shopping cart abandonment rate, and lifetime value. These ecommerce metrics span financial unit economics and funnel performance, and should be reviewed on a cadence aligned to the metric.
How does cohort analysis differ from standard monthly reporting?
Cohort analysis tracks behaviour over time for specific customer groups, revealing retention and quality trends that monthly aggregates obscure. Standard reports show what happened in total; cohort analysis shows what happened to specific groups of customers as they matured.
How can analytics support ecommerce personalisation?
Analytics combines behavioural signals and journey context to enable targeted messaging and product recommendations. This approach, described in detail through analytics for personalisation, also allows you to measure the genuine lift from each campaign rather than relying on blended attribution.
What are common pitfalls with analytics as retailers scale?
Misleading dashboards often result from unreconciled returns, inconsistent attribution windows, or bundle revenue misattribution. Analytics stacks at scale frequently require custom data models to produce accurate SKU-level unit economics.
When should benchmarks or industry standards be used in ecommerce analytics?
Benchmarks provide useful context but should always be paired with your store’s own historical baseline. Industry benchmarks vary widely by segment and definition, so internal trend data is always the more reliable foundation for decision-making.

.png)